
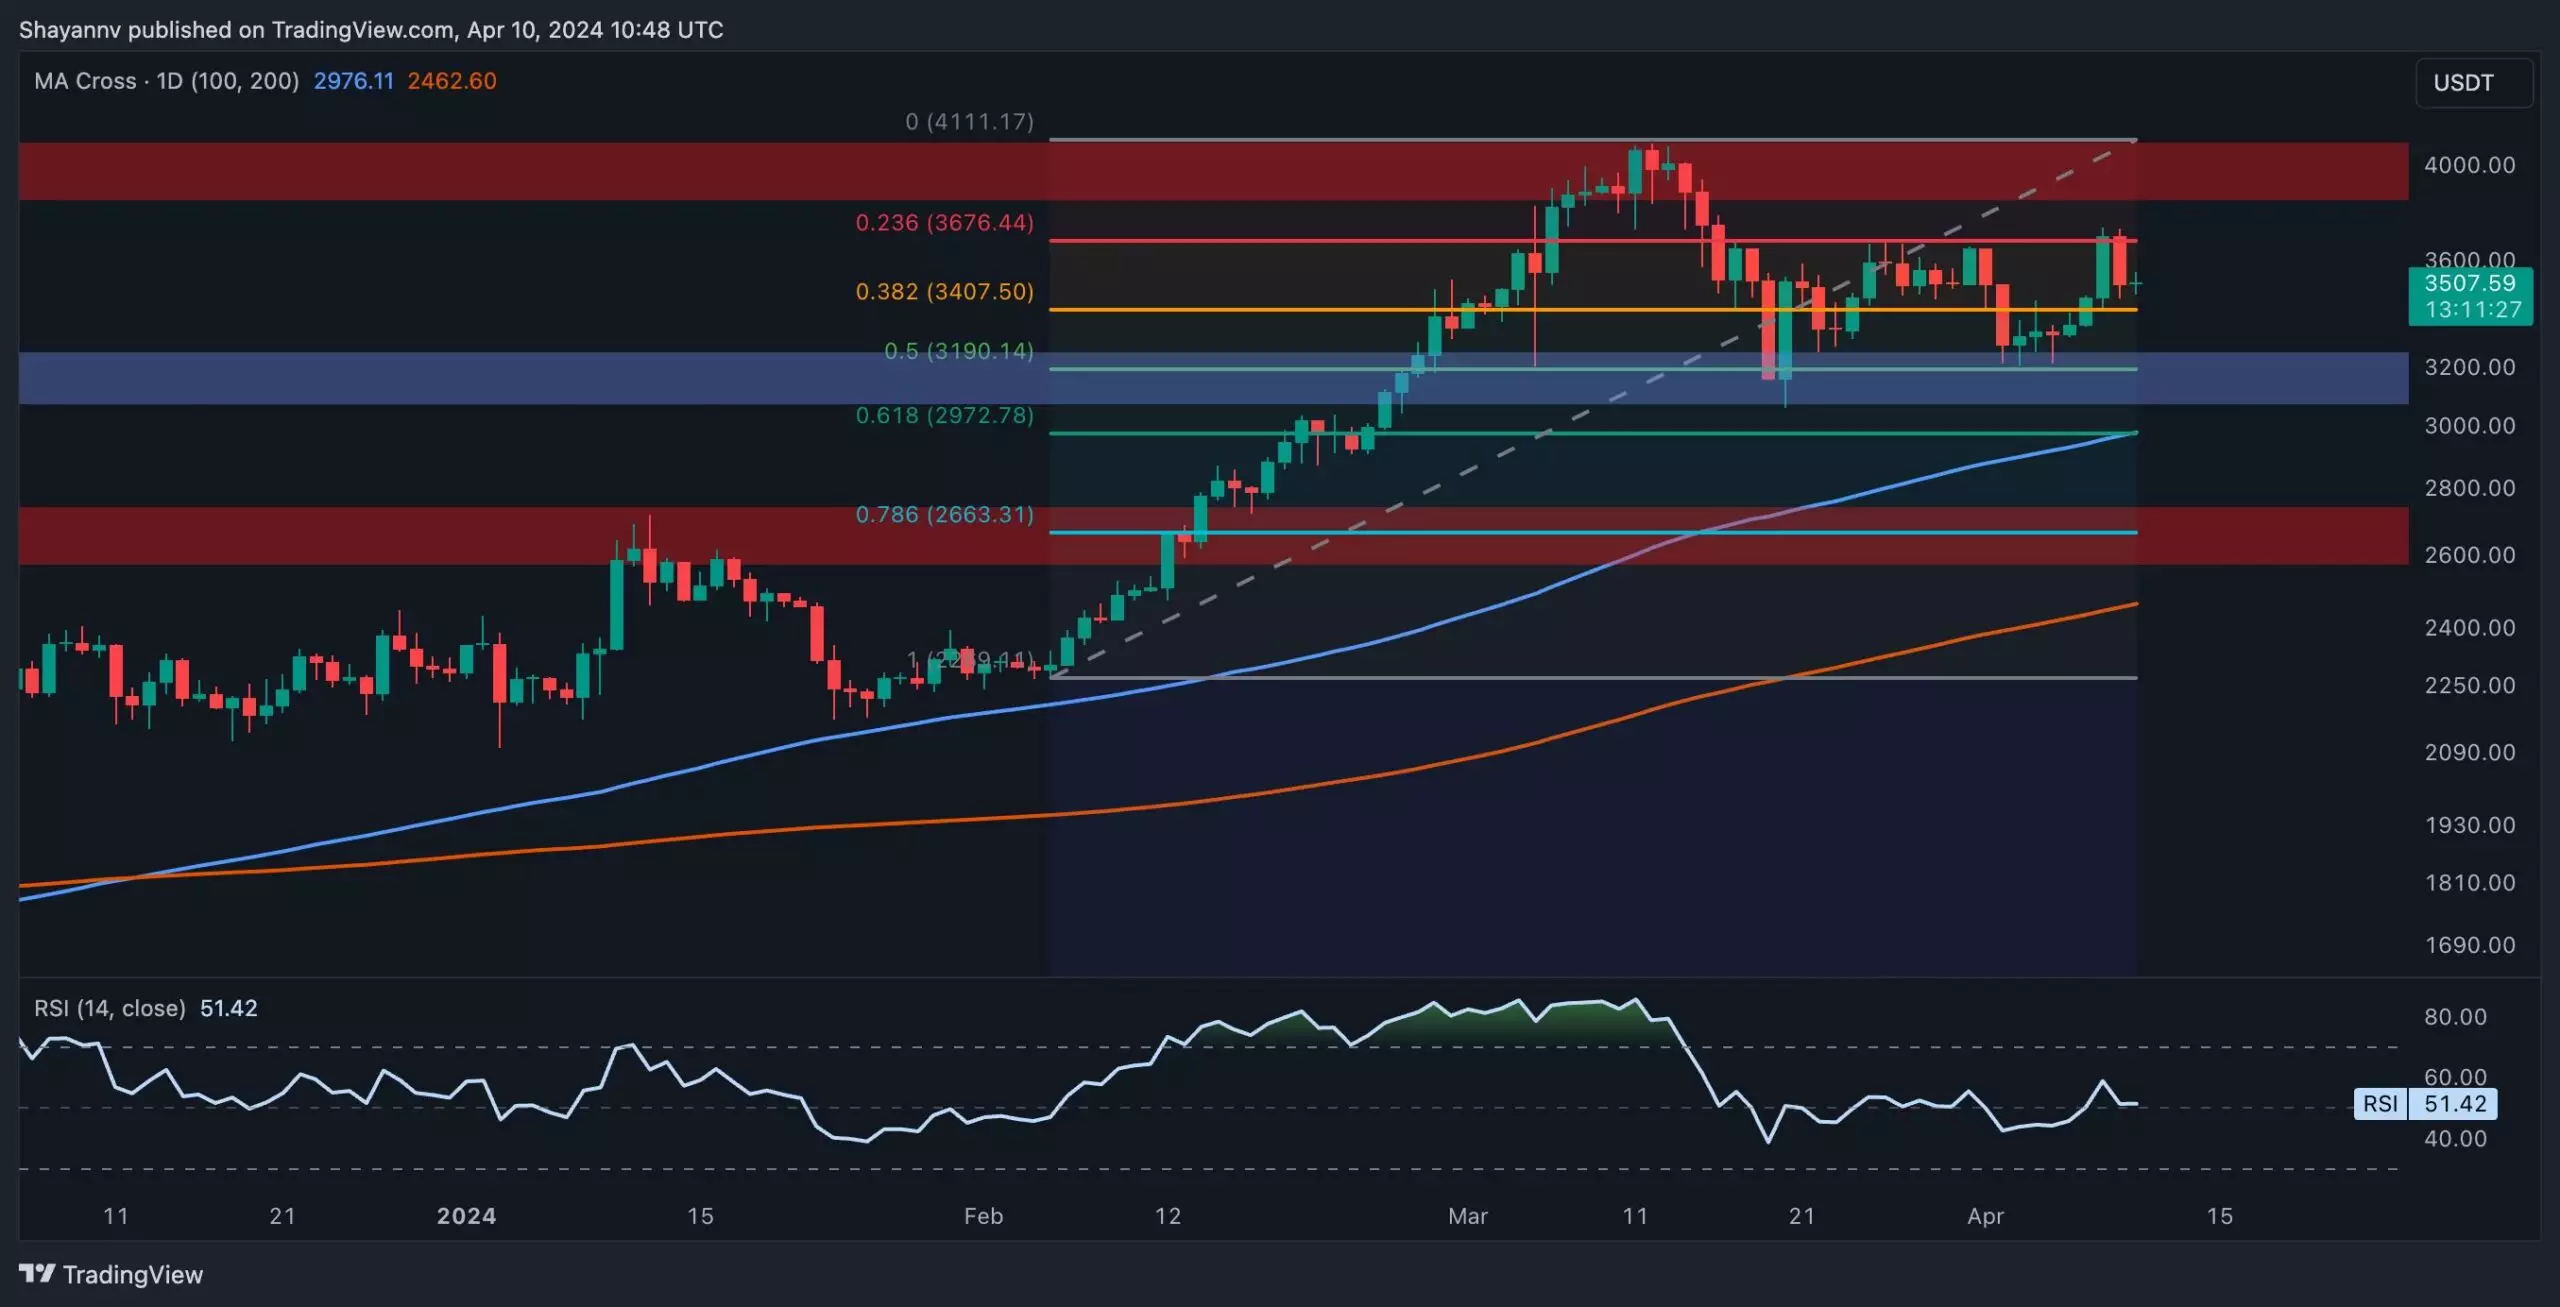
Ethereum has been experiencing a prolonged phase of sideways consolidation following a decline to the critical support level of $3K. The cryptocurrency seems to be stuck within a range of $3K to $3.7K, with minimal volatility expected unless a breakout occurs in either direction. The daily chart analysis reveals that Ethereum found substantial support around the $3K threshold, which aligns with significant Fibonacci retracement levels and the pivotal 100-day moving average. This support zone triggered a rebound pushing ETH towards the upper boundary of the range at $3.7K. However, resistance near this upper boundary indicates the presence of sellers in the market.
A closer look at the 4-hour chart shows the formation of a sideways wedge pattern during corrective retracements. Typically, such patterns suggest a continuation of the bullish trend upon breakout from the upper boundary. Ethereum experienced strong buying pressure around the $3K support level, leading to a bullish momentum that breached the upper boundary of the wedge. However, upon reaching the resistance level of $3.7K, Ethereum faced rejection and a slight retracement followed. The price has since returned to the broken level of the wedge, potentially completing a pullback. If successful, Ethereum’s price may see another upswing towards the $3.7K threshold, but a bearish retracement to $3.2K cannot be ruled out.
While Ethereum’s price has been showing signs of rebound, it is crucial to determine whether this is driven by spot buying pressure or leveraged futures positions. Analysis of the exchange reserve metric, which measures the amount of ETH held on exchange wallets, indicates that investors have been withdrawing ETH from exchanges. This withdrawal trend signifies spot buying pressure in the market. The spot market demand is playing a significant role in a potential rally higher, suggesting a more sustainable uptrend for Ethereum.
Ethereum’s price is currently stuck in a range between $3K and $3.7K, with minimal volatility expected unless a breakout occurs. The presence of sellers near the upper boundary of the range suggests potential resistance, while the formation of a sideways wedge pattern indicates a continuation of the bullish trend upon breakout. Spot buying pressure is driving the current rebound in Ethereum’s price, hinting at a sustainable uptrend. Investors should closely monitor price movements and breakout levels to capitalize on potential opportunities in the market.


Leave a Reply