
Ethereum’s current market dynamic is characterized by pivotal price patterns that may impact its trajectory. With significant formations such as the inverted head and shoulders pattern on the daily chart and a double-bottom formation occurring on the 4-hour chart, traders and analysts find themselves at a precipice. This article delves into these key patterns, critical support and resistance levels, and their implications for Ethereum’s forthcoming movements.
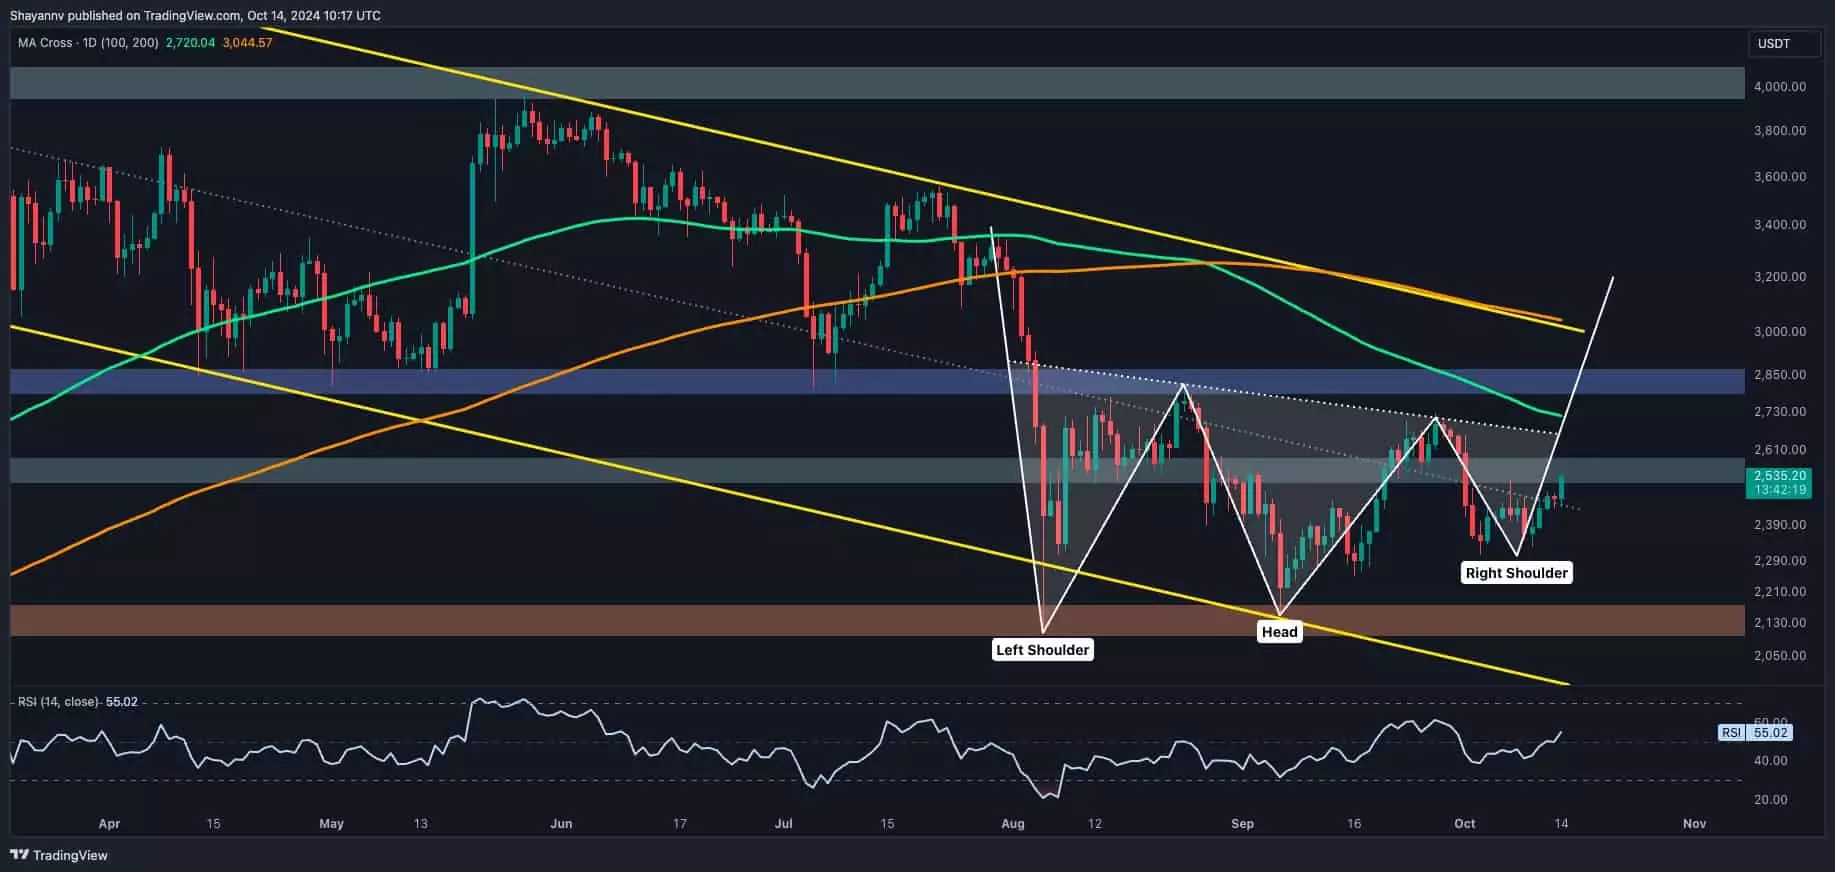
At the heart of Ethereum’s recent movements is the inverted head and shoulders pattern emerging in the vicinity of the $2.1K support area. This pattern serves as a classical bullish reversal indication, with the potential to catalyze a price rally if it manages to breach the neckline situated at approximately $2.7K. This inverted formation is contrasted against the backdrop of recent bearishness, as the cryptocurrency has been wrestling with overall downward momentum. Should Ethereum confirm this pattern by closing above $2.7K, it could set the stage for a bullish run, potentially targeting the $3K resistance level, which looms as a significant psychological barrier.
In addition to the daily chart’s inverted head and shoulders pattern, Ethereum’s 4-hour chart reveals a double-bottom formation. This indication often suggests that the asset is finding renewed buying interest at lower levels, ideally leading to upward momentum. Unlike its daily counterpart, which signals a longer-term shift, the double-bottom pattern is more short-term focused, highlighting a probable area of accumulation that may soon serve as a launchpad for a price increase.
The technical landscape for Ethereum is currently navigating a well-defined range, oscillating between $2.1K and $2.7K. The importance of these levels cannot be overstated. A breakdown below $2.1K could be detrimental, as it would signify a sustained bearish sentiment, perhaps catalyzing a swift move towards the psychological $2K barrier, which is bolstered by substantial whale activity and liquidity defense.
Conversely, if Ethereum surmounts the $2.7K barrier, it could signify a transition to bullish behavior. Notably, the area around $2.5K is a crucial midpoint in the multi-month channel that tracks Ethereum’s price performance. Successfully breaking this midpoint could suggest that the bulls have reclaimed control, shifting their focus onto the neckline and the potential future target of $3K.
Market dynamics around key Fibonacci levels are also critical in this scenario. The 0.5 Fibonacci retracement level at $2.6K acts as a resistance zone, while the 0.618 level at $2.8K represents a formidable barrier where traders have significant stakes. The visibility of these levels on the charts further compounds the likelihood of volatility, as market participants watch for momentum shifts that could trigger cascading liquidations.
A further examination of Ethereum’s trading landscape reveals a complex web of liquidity pools, indicative of larger traders’ belief on the price direction. Analyzing the Binance liquidation heatmap, traders can observe concentrated liquidity zones, particularly near the critical support at $2K and the overhead resistance at $2.8K. Such areas are reflective of stop-loss orders, providing clarity on possible market reactions once a decisive breakout occurs.
In the current environment, Ethereum trades within a tenuous consolidation phase with compact price movements, suggesting a balance between buying and selling pressures. As consolidations precede significant price movements, the anticipation of a breakout remains heightened. With whales closely monitoring these levels, a movement past either $2.1K or $2.7K could trigger a chain reaction—creating a fortified advance or a steep decline.
As Ethereum navigates this pivotal moment, traders must remain cautious yet optimistic. The presence of the inverted head and shoulders and double-bottom patterns provide a glimpse into potential reversals, but underlying market conditions and liquidity concentrations must be watched attentively. Whether Ethereum solidifies a trajectory toward bullish territory or succumbs to lingering bearish sentiment will ultimately hinge on its ability to sustain movement around these critical price levels. Thus, being vigilant in tracking Ethereum’s price action in the upcoming days will be crucial for discerning its next significant directional shift.


Leave a Reply