
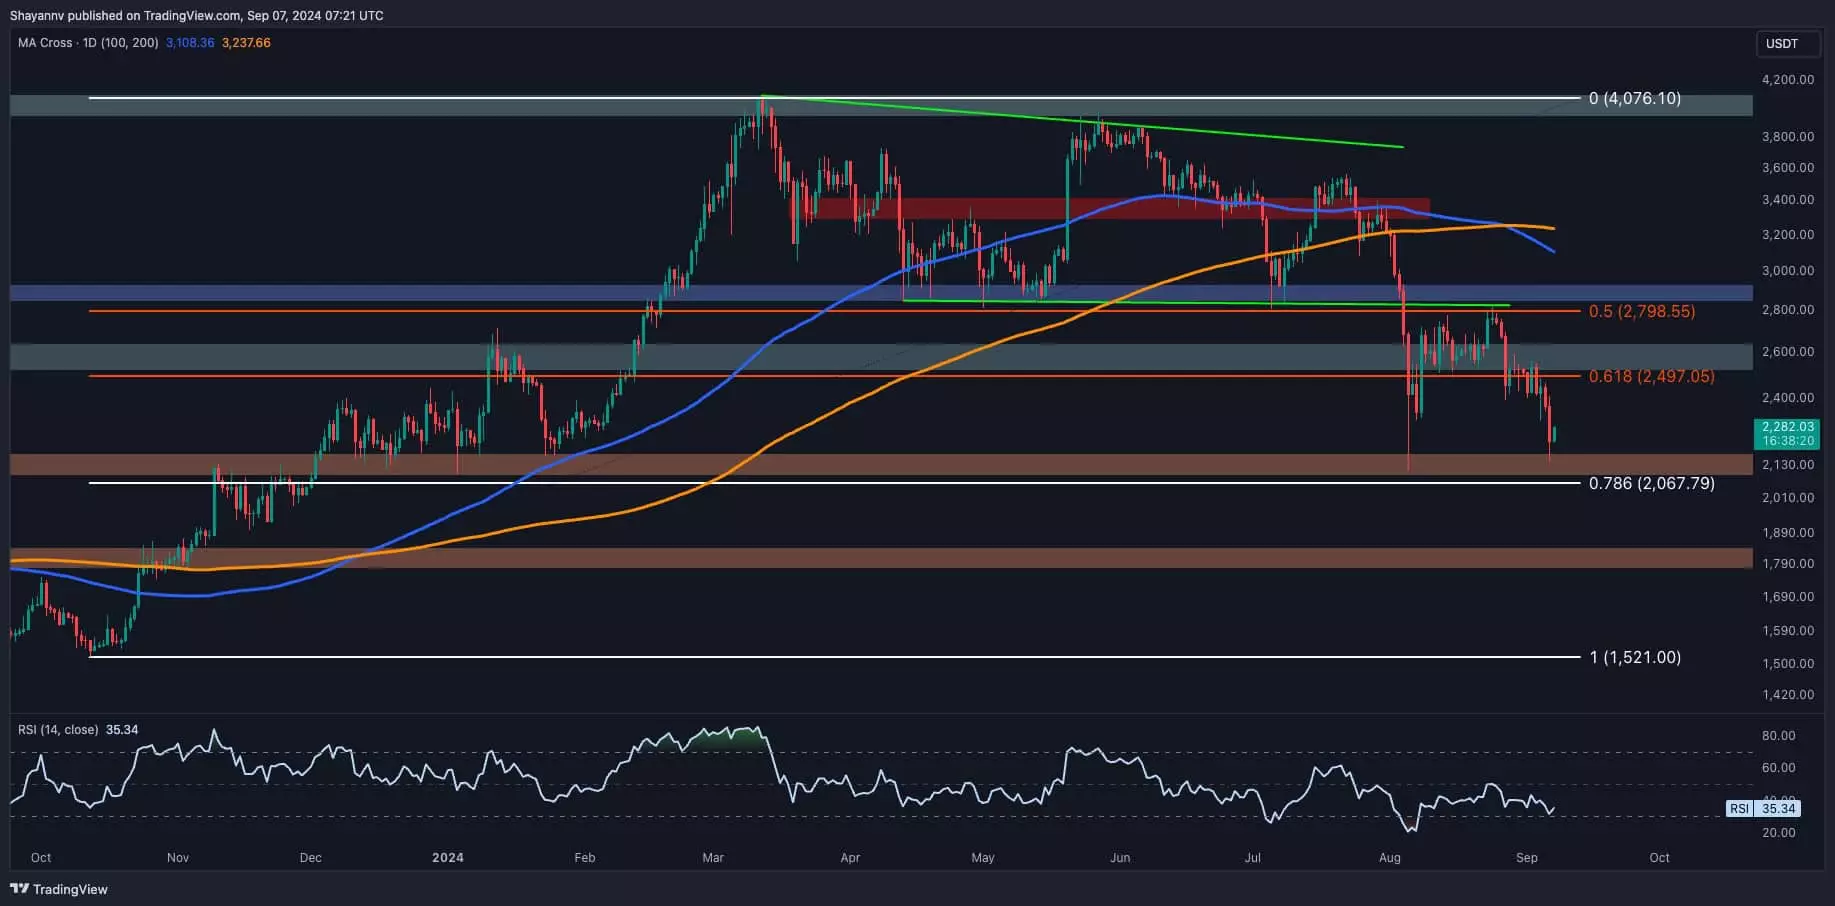
The current state of Ethereum reflects a prominent bearish trend that has caused fear and uncertainty among market participants. The decline in Ethereum’s price, marked by a sharp pullback to the lower boundary of a broken wedge, has been further exacerbated by the formation of a death cross. This technical indicator, where the 100-day moving average crosses below the 200-day moving average, has added to the prevailing negative sentiment surrounding Ethereum. Low inflows into spot ETH ETFs also signal reduced investor interest in the cryptocurrency.
Key Support Levels and Potential Sideways Consolidation
Despite the bearish trend, Ethereum’s price is approaching a crucial support level that could potentially lead to a short-term sideways consolidation. The static $2.1K level and the 0.786 Fibonacci retracement level at $2,067 represent a critical support zone for Ethereum. This area is expected to attract substantial demand, potentially pausing the downtrend and prompting sideways price movement.
On the 4-hour chart, Ethereum faced significant resistance between the 0.5 ($2.6K) and 0.618 ($2.7K) Fibonacci levels, leading to continued bearish momentum toward the $2.1K support level. Historically, this level has held in early August, suggesting a possible accumulation zone for buyers. Whether Ethereum experiences temporary consolidation or faces deeper correction hinges on the response at the $2.1K support. A breach of this level could trigger a long-liquidation event, driving the price down toward the $1.8K region.
Understanding Ethereum’s Value and User Engagement
Ethereum’s value is inherently tied to its decentralized network and the active engagement of its users. An essential metric for gauging user engagement is the number of unique active addresses on the network. This metric serves as a valuable proxy for Ethereum’s market demand and valuation. As depicted in the 14-day moving average chart of Ethereum Active Addresses, there has been a notable decline since late March 2024.
This downward trend in active addresses reflects reduced user activity, transaction volumes, and overall market demand for Ethereum. For Ethereum to recover and potentially initiate a sustainable rally, this trend must reverse. A resurgence in active addresses would signify increasing interest, accumulation of Ethereum, and the potential for a bullish market reversal.
Ethereum stands at a critical juncture, with key support levels and user engagement metrics playing a pivotal role in determining its future trajectory. Market participants closely watch for signs of demand resurgence at the $2.1K support level to gauge Ethereum’s ability to hold crucial levels and avoid further downside pressure. The coming days will be instrumental in defining Ethereum’s short-term price action and long-term market outlook.


Leave a Reply