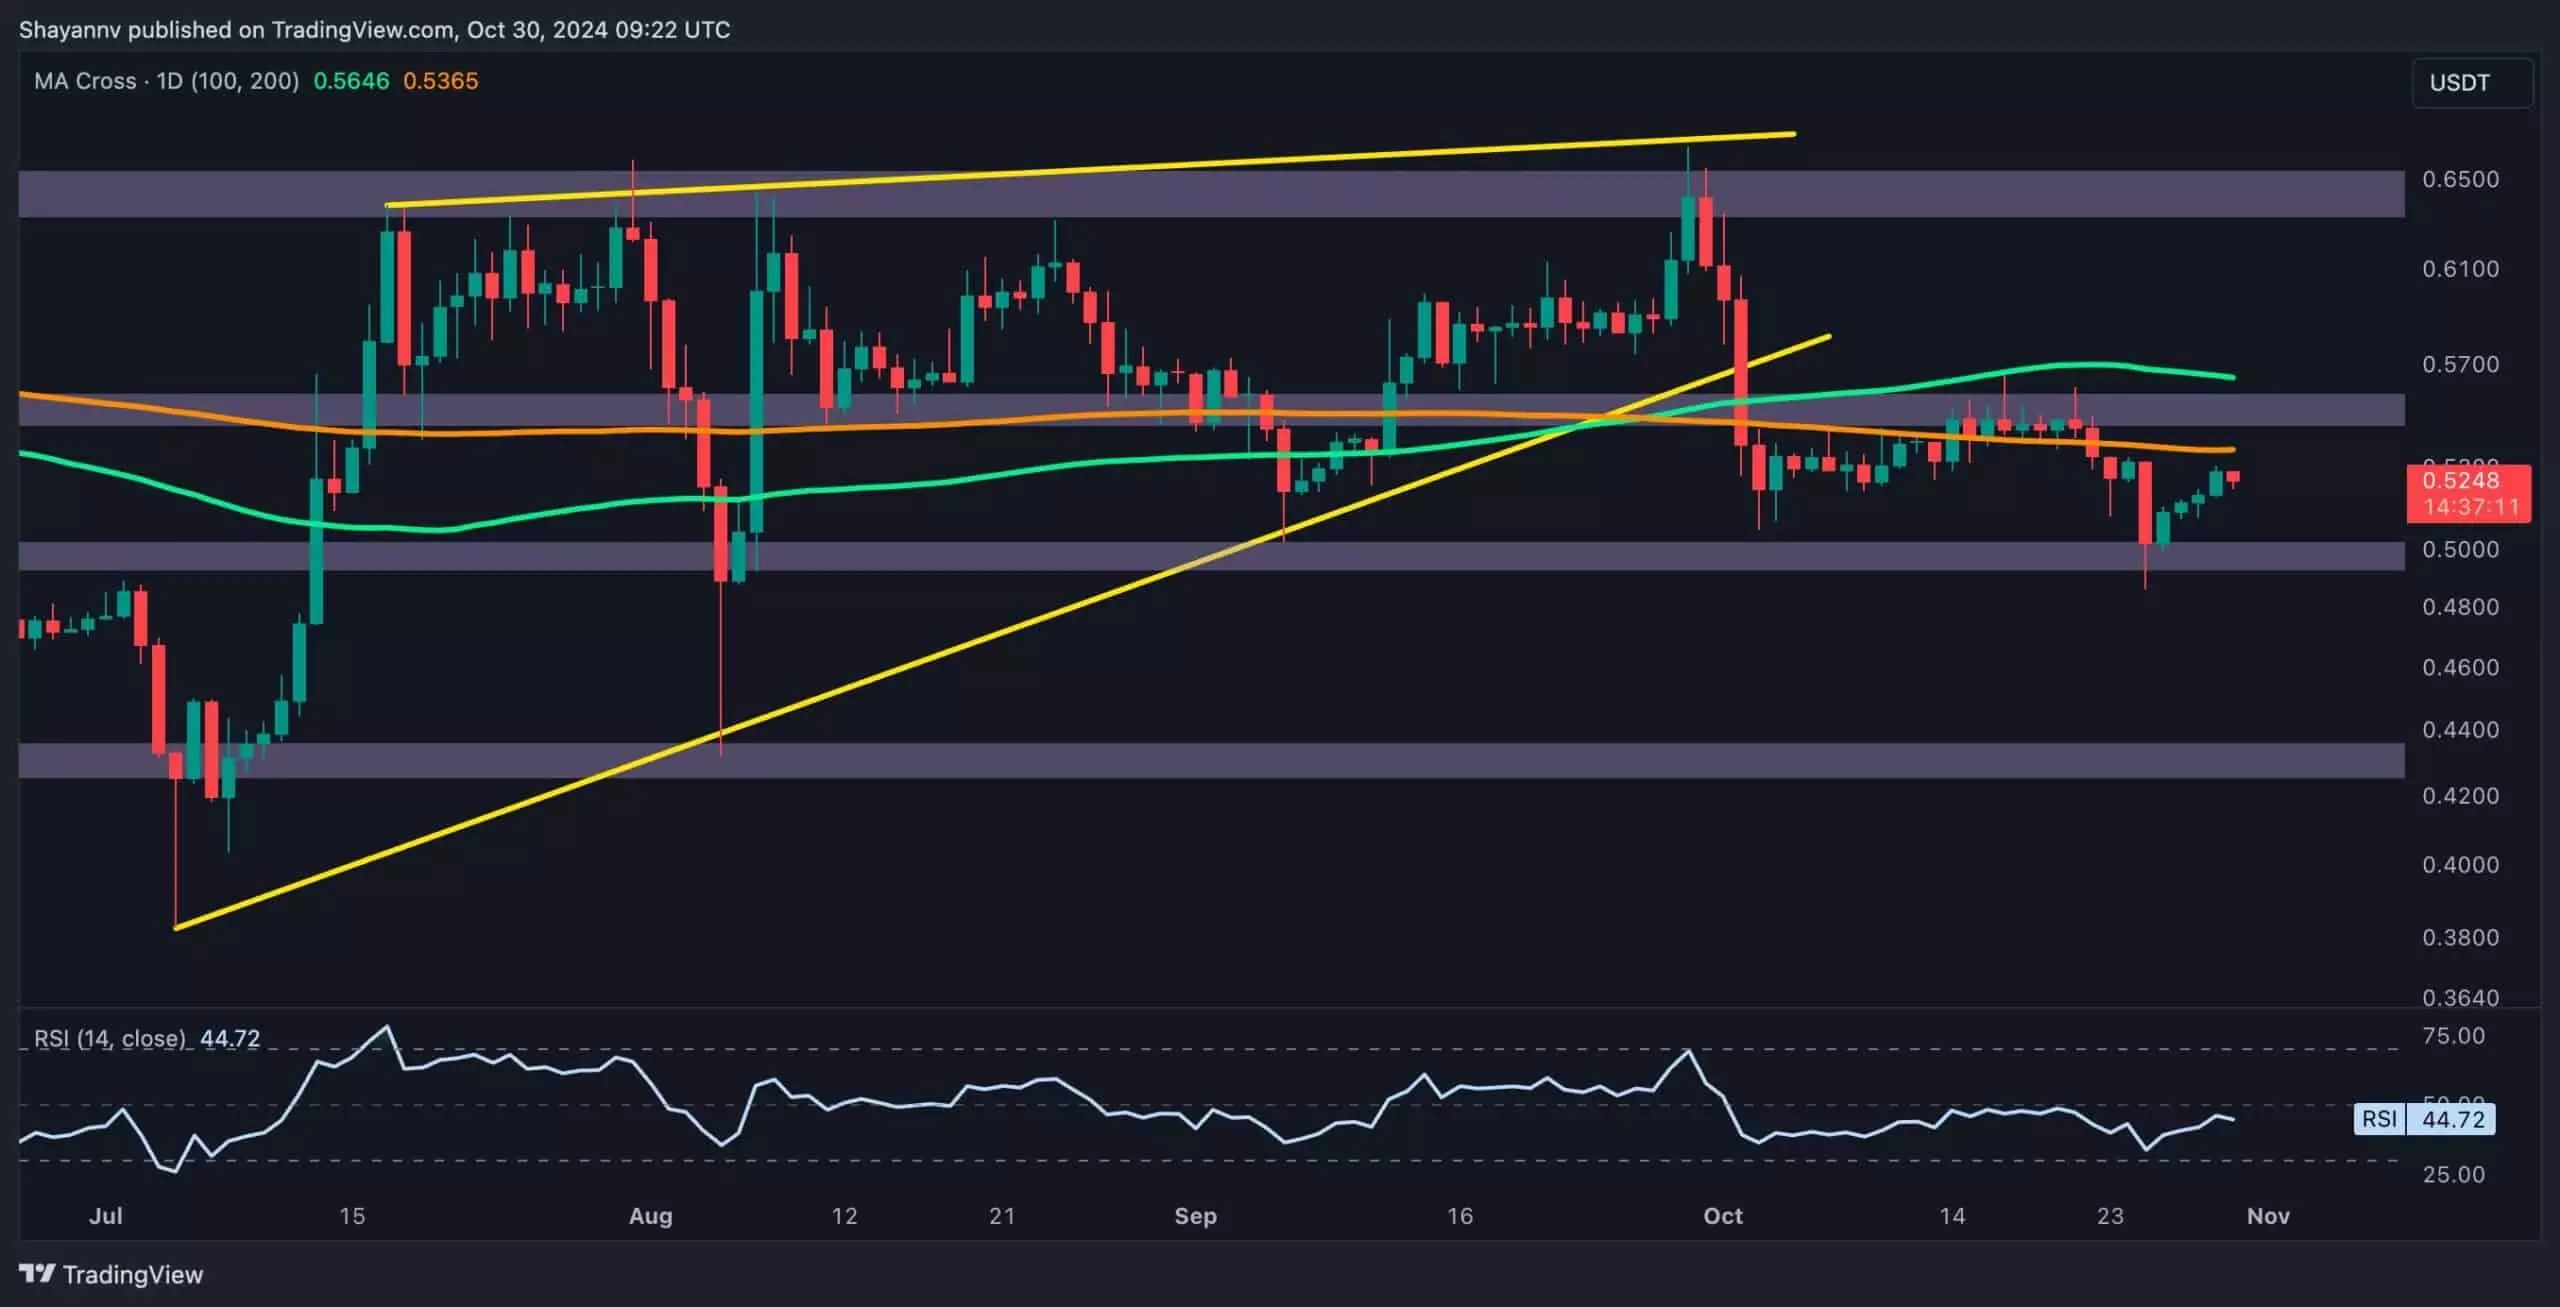
The cryptocurrency market has always been notorious for its volatility, and recent movements from Ripple (XRP) are no exception. The digital asset has shown signs of a cautious rebound, temporarily moving away from the crucial $0.5 support zone and approaching the 200-day moving average. However, traders are facing a dilemma: is this a genuine recovery or merely a reluctant bear market bounce? The upcoming price action will significantly depend on the asset’s ability to maintain momentum against well-established resistance levels.
Price Resistance and Selling Pressure
XRP’s daily chart paints a picture of a struggle between buyers and sellers. Shortly after attempting to reclaim the 200-day moving average around $0.57, Ripple encountered renewed selling pressure. This resistance level has historically been a challenging barrier for the cryptocurrency and is an essential indicator of its capability to rally. Failure to hold above this moving average raises red flags; a breakdown through this crucial juncture would likely solidify an ongoing bearish trend and invite further selling from nervous traders.
The notable price movements hint at a market ripe for volatility. If XRP cannot maintain its position, the immediate concern shifts to the $0.5 support level. This threshold has acted as a longstanding defense for buyers, and a breakdown below it could catalyze a larger-scale decline towards the $0.46 mark.
Analyzing the 4-hour chart reveals a more intricate formation for Ripple. This timeframe showcases a descending consolidation pattern steeped in a critical support zone, notably defined by the Fibonacci retracement levels of 0.5 ($0.52) and 0.618 ($0.49). These levels are significant as they have consistently offered support over multiple months, making them pivotal areas to watch closely.
Recently, traders have witnessed a descending wedge pattern taking shape within the $0.49-$0.52 range. A recent uptick in buying pressure pushed XRP towards the upper boundary of this wedge at $0.53, indicating that there are still some bulls willing to defend the price levels. A breakout above this crucial threshold may signal a tactical shift toward a bullish rebound, providing a short-term target near the $0.55 resistance.
Despite pockets of potential optimism, the prevailing market sentiment continues to lean bearish. Given the underlying downward trends and historical resistance, a rejection at the $0.53 level seems plausible. Such a scenario could prompt a retraction back toward the $0.5 support area, raising concerns about further declines in the days ahead.
Ripple’s current price action amidst support and resistance highlights a critical juncture for traders. The asset’s ability to navigate these challenging waters will determine its future trajectory, and significant caution is warranted as market sentiment remains delicate and influenced by prevailing bearish conditions. Investors will need to remain vigilant and adaptable as Ripple’s performance continues to unfold in this unpredictable landscape.


Leave a Reply