
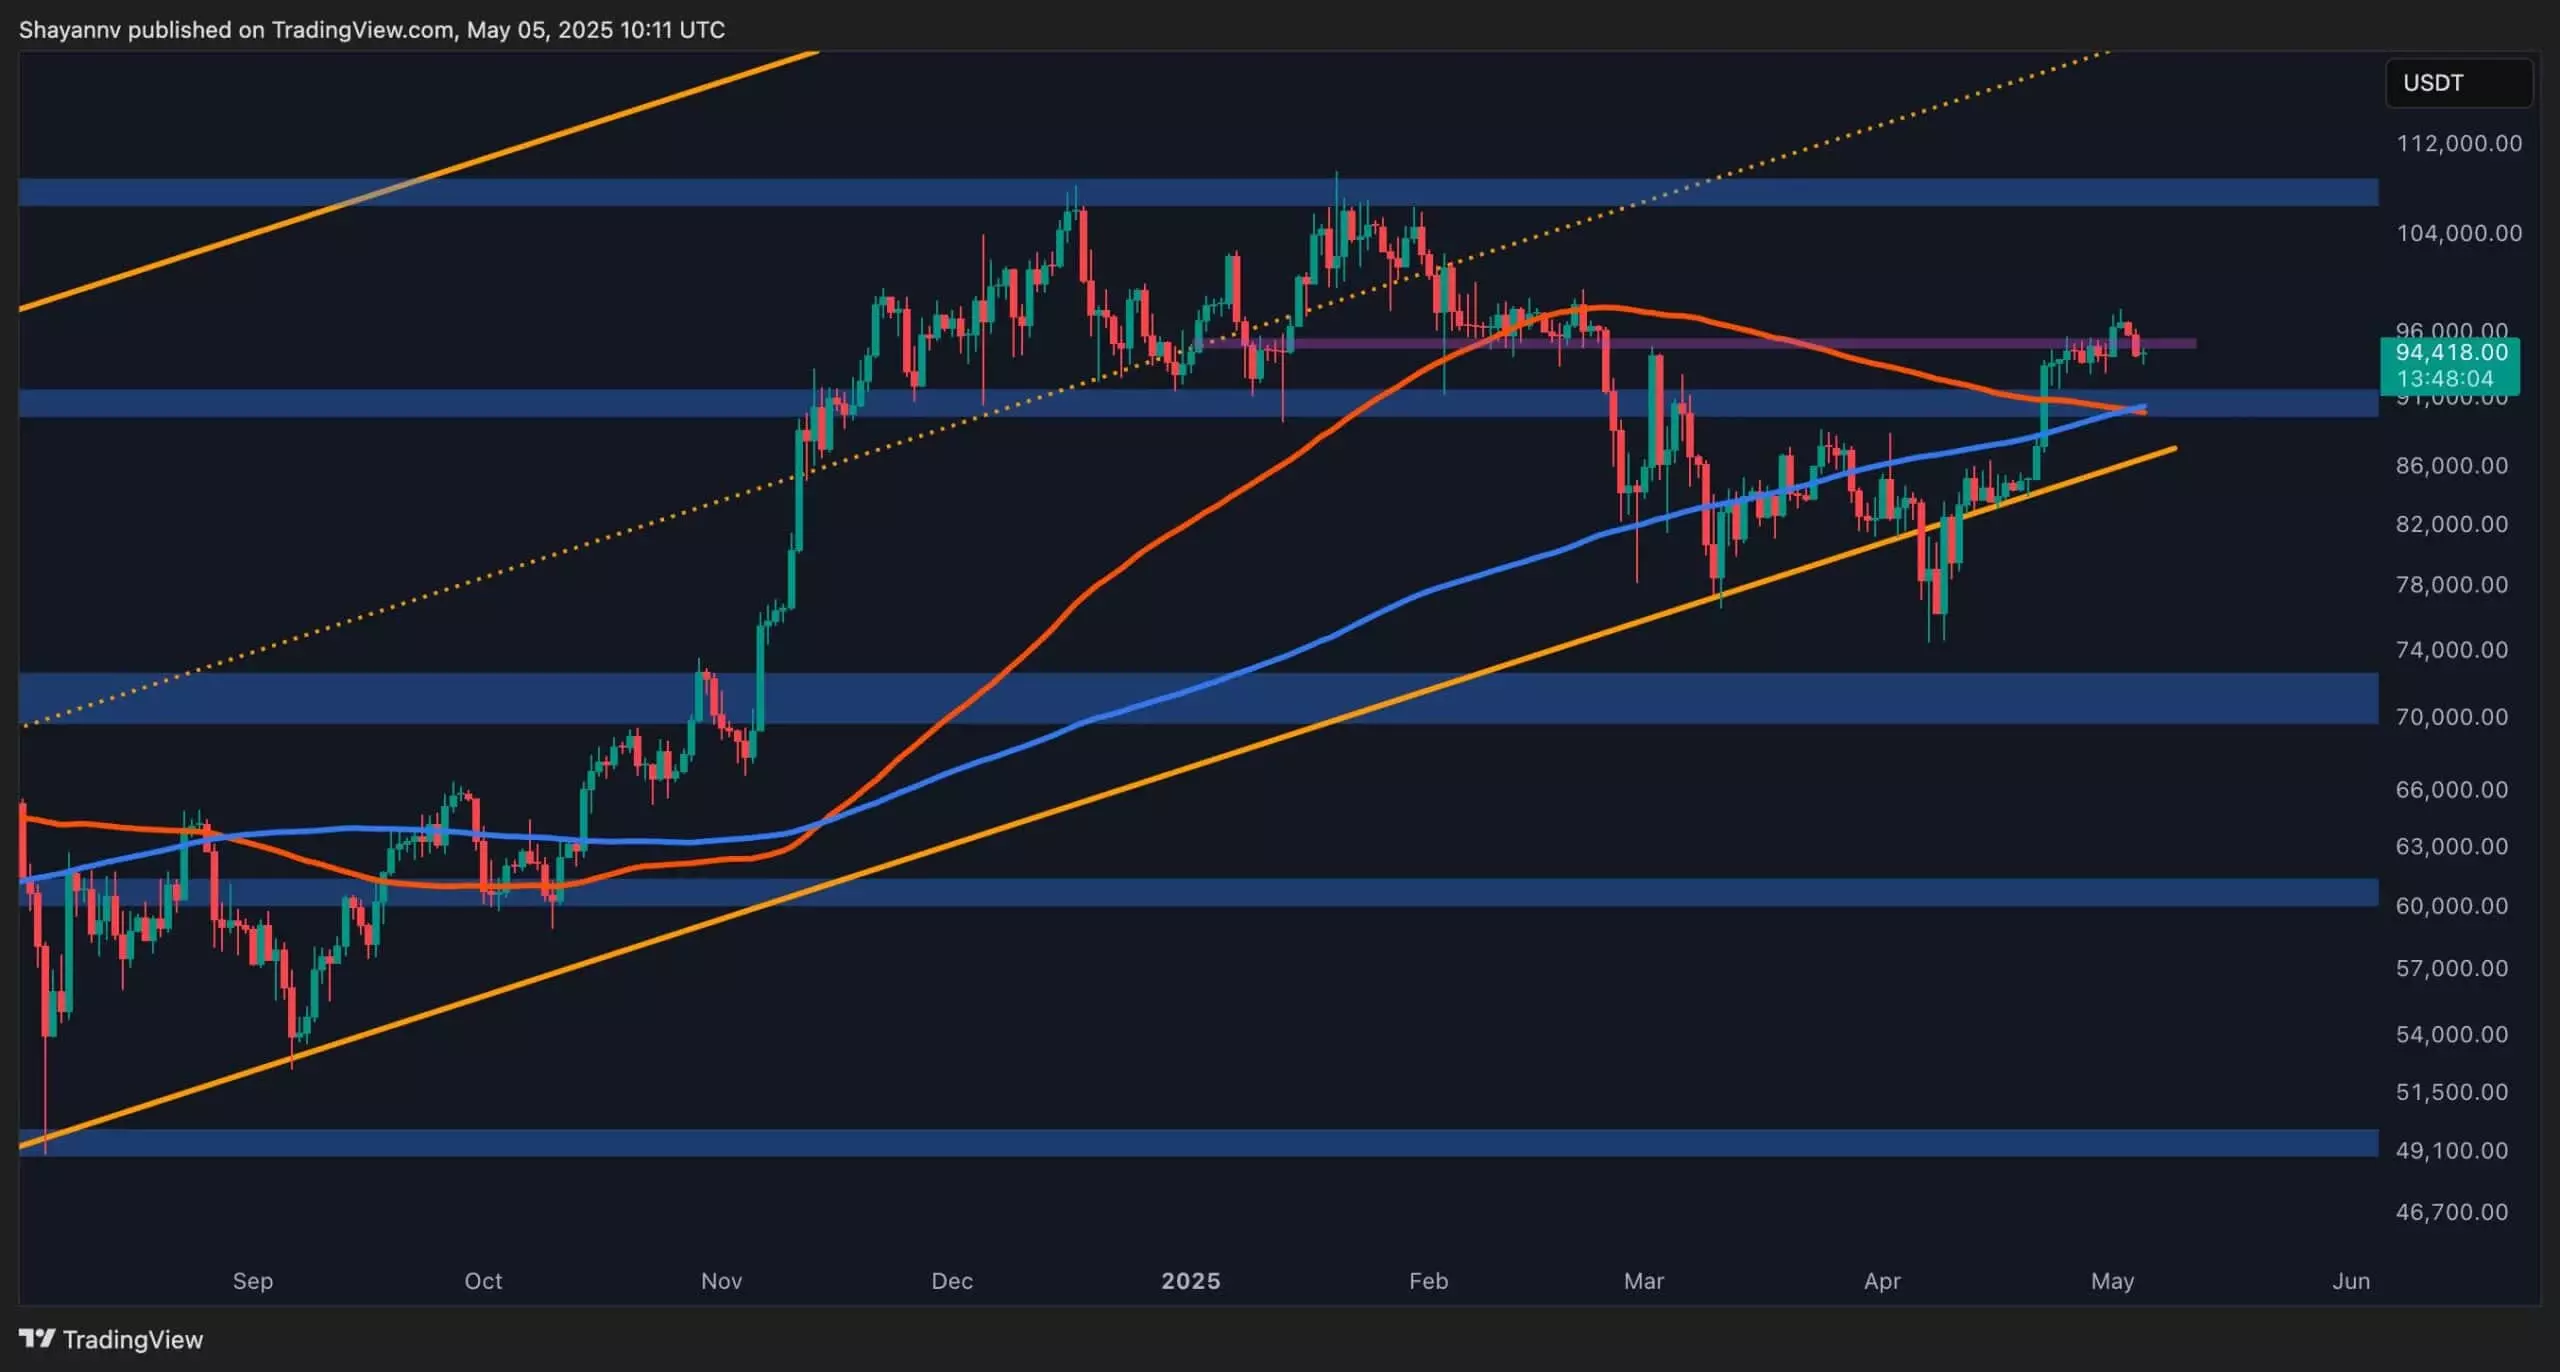
Bitcoin is currently positioned just beneath the $96,000 barrier, a psychological threshold that holds significant sway over market sentiment. After an impressive surge in late April, BTC finds itself stabilizing, hovering around key support that has become a battleground for bulls and bears alike. The criticality of the $91,000 support level cannot be understated; as Bitcoin oscillates in a tight range, it reflects the market’s attempt to consolidate gains, a behavior often witnessed in bullish trends.
While momentum has softened a bit, indicating a rare moment of indecision, there are no alarm bells ringing yet regarding a potential bearish trend reversal. Instead, Bitcoin’s ability to consistently trade above critical moving averages, including the 100-day and 200-day, emphasizes the underlying stability and bullish structure. It’s worth noting that resistance points are merely obstacles for a powerful asset like Bitcoin; and with each test of the $95,000 mark, we may just be on the verge of a breakout.
The Ascending Channel: A Double-Edged Sword
Digging deeper into Bitcoin’s short-term technical analysis reveals an ascending channel pattern on the 4-hour chart, a formation that implies a looming decision point for traders. This channel, which ordinarily signals a slowdown in bullish momentum, begs the question: are we witnessing a local top, or merely a momentary pause before a significant jump? At this juncture, Bitcoin is on the brink of testing the lower boundary of this channel around the $94,000 to $94,500 range. Should this support falter, the market faces the potential of descending to the more critical $92,000 mark.
Conversely, a decisive breach past the $96,000 resistance could very well unleash a buying frenzy, potentially pushing prices up toward the psychologically important $100,000 target. This tension between the potential for downside risk and bullish continuation embodies the volatile essence of cryptocurrency trading—where conviction can shift rapidly but, when it aligns with underlying fundamentals, often leads to breakout movements.
On-Chain Metrics: A Bullish Narrative in the Face of Doubt
What makes Bitcoin’s current environment even more compelling is the positive sentiment reflected in on-chain metrics. The Spent Output Profit Ratio (SOPR), staying above the critical value of 1.0, indicates that holders are predominantly liquidating at a profit. This data is vital; it means that rather than facing excessive sell pressure, there is a prevailing confidence within the market. The recent rebound in the SOPR alongside price fluctuations reinforces the notion that investors are not hastily exiting their positions even after significant price rallies.
Such indicators reflect a robust market structure that supports upward momentum rather than steep corrections. This sentiment translates into a resilient bullish trend—one that can endure market corrections without collapsing under pressure.
The current landscape of Bitcoin trading illustrates a microcosm of the broader cryptocurrency market—a blend of human psychology and economic principles at play. As skepticism lingers over traditional financial systems, Bitcoin’s structural integrity serves as a beacon of hope for those advocating for fiscal innovation and reform. The journey toward the elusive $100,000 could reveal whether this digital currency can not only maintain its momentum but also redefine the boundaries of financial stability and growth in a rapidly evolving world.


Leave a Reply