
Ripple (XRP), a prominent player in the cryptocurrency market, has recently experienced a slight pullback, encountering resistance at the $2.8 threshold. This resistance has triggered a minor decline, yet this scenario is unfolding as Ripple approaches a significant support zone. Such conditions suggest a potential bullish reversal could be on the horizon, particularly with the current consolidation phase reflecting a broader uncertainty in the market.
The price action of Ripple has predominantly been characterized by an expanding wedge pattern, indicating fluctuating volatility and investor indecision. This pattern typically serves as a precursor to a directional breakout, and understanding this can provide insight into potential future movements. Although trading activity has dwindled, the observed consolidation suggests that sellers are currently hesitant. Key support zones act as defensive barriers, ensuring that buyers are positioned to potentially capitalize on a bullish trend.
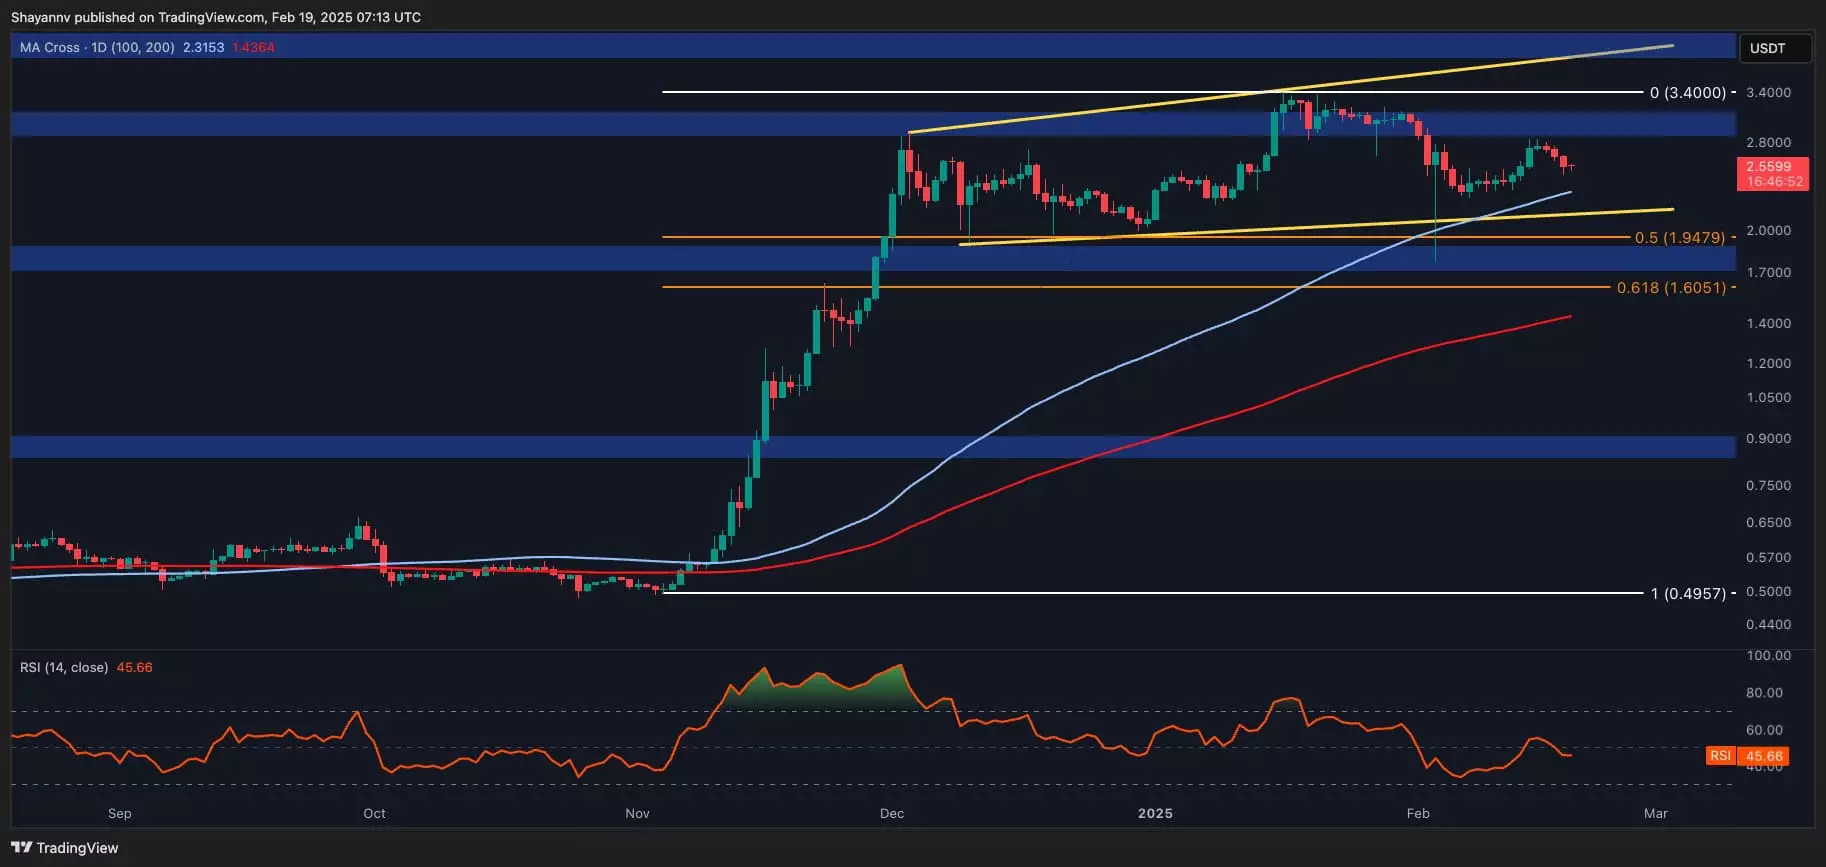
Key support levels are identified at the 100-day moving average situated at $2.3, alongside the critical $2 support zone. Moreover, Fibonacci retracement levels mark the region between $1.9 and $1.6, adding to the significance of these support structures. These points of interest collectively enhance the likelihood of a bullish rebound in the long run, establishing multiple robust defense lines that may help stabilize the price in the short term.
Analyzing the 4-hour time frame helps clarify Ripple’s immediate market dynamics. With a notable rejection around the $2.8 resistance, the asset’s price has understandably dipped slightly. This decline, however, should be seen in the context of the approaching support around $2.3, which encompasses the lower boundary of the recently identified ascending wedge. A rebound at this support level is anticipated, as it holds potential to substantially stall further downtrends.
Yet, the narrative could change swiftly. A break beneath the $2.3 support could amplify selling pressure, propelling the price further toward the key $2 threshold. Should this occur, liquidations might accelerate, leading to a cascading effect that could substantially alter the asset’s trajectory. Therefore, it is crucial for traders to monitor XRP’s price movement in relation to the wedge’s lower boundary, as it signifies an inflection point that could dictate short-term price action.
Ripple’s recent price movements highlight the delicate balance between resistance and support. The consolidation phase and the surrounding technical indicators suggest that while short-term outcomes may remain speculative, the potential for a bullish resurgence seems promising. Traders and investors should remain vigilant, as the next few trading sessions will likely determine the asset’s direction in an evolving market landscape. Understanding these patterns and support zones will be essential for making informed decisions in a space defined by its volatility and rapid changes.


Leave a Reply