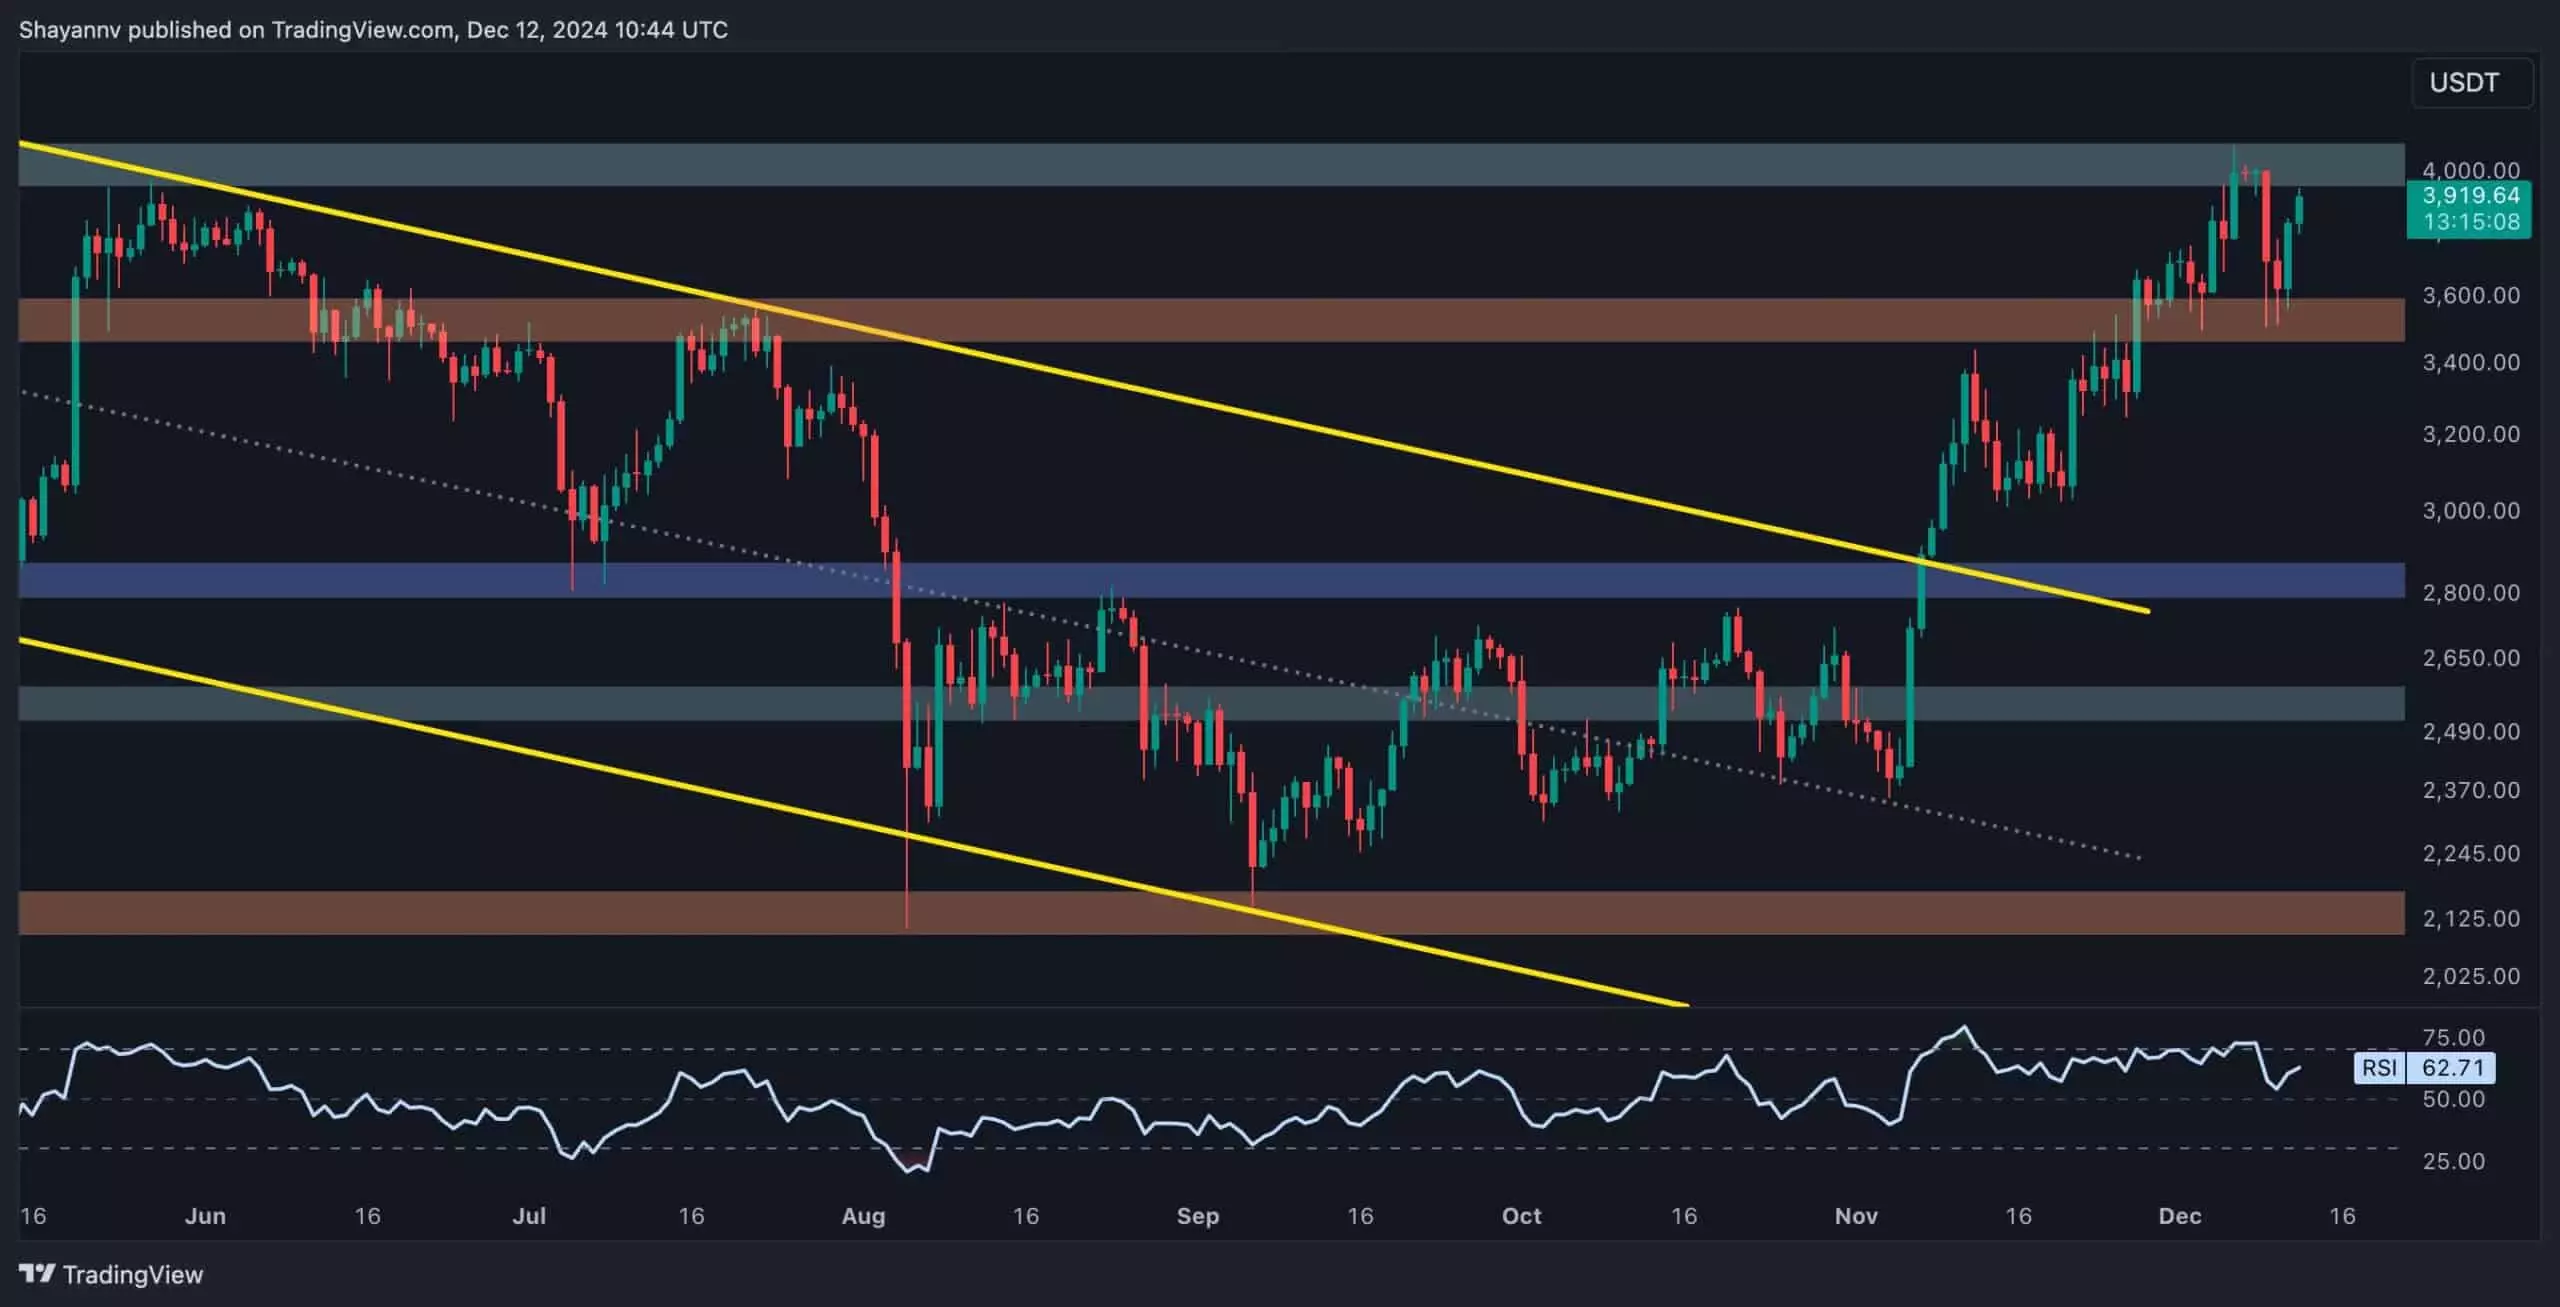
Ethereum (ETH) has firmly nestled itself within the crucial price band of $3,500 to $4,000. Recently, it found a supportive footing at the lower end, $3,500, indicating resilient buying interest in this range. The current market behavior suggests that after encountering resistance at the upper limit of $4,000, bulls are gearing up for another attempt to surpass this pivotal threshold. Observations in trading activity illuminate a frequently contested territory where buyers and sellers are locked in a near-constant struggle.
The $4,000 mark has emerged as a significant psychological barrier for Ethereum, attracting substantial selling pressure during previous rallies. This crucial resistance area has historically acted as a ceiling, thwarting multiple bullish endeavors. When Ethereum’s price approaches this level, it often triggers selling from traders who anticipate a downturn. As seen in recent market movements, this rejection at $4,000 is contributing to a back-and-forth oscillation between the two bounds of the current trading range.
Given that price action has repeatedly retreated to the $3,500 floor, it raises questions about the sustainability of the bullish momentum. Buyers’ attempts to reclaim the upper barrier may gain traction, yet without a decisive break above $4,000, the potential for further retracement remains a distinct possibility.
As Ethereum faced notable rejection around the $4,000 zone, it experienced a consequential drop, landing below the median channel around $3,800. This pattern emphasizes the compelling presence of sellers at $4,000, reinforcing its status as a formidable resistance point. However, the relentless support at $3,500 has spurred renewed buying, enabling Ethereum to climb back towards the established resistance.
In examining the four-hour trading chart, traders might note bearish divergence on the Relative Strength Index (RSI), an indicator suggesting potential overbought conditions. This phenomenon raises caution flags for those optimistic about an imminent breakthrough, as a short-term consolidation below $4,000 appears likely before any possible upward movement materializes.
The liquidity landscape surrounding Ethereum reveals significant accumulation levels at both the $3,500 and $4,000 thresholds. The Binance liquidation heatmap illustrates the potential for volatility triggered by liquidity clusters inherent in the market’s structure. Specifically, a successful break above $4,000 could ignite a short-squeeze, where short-sellers are compelled to cover their positions, potentially propelling prices further upward.
Conversely, should ETH fail to break past its resistance and instead fall back to the $3,500 support, a liquidation cascade could also ensue, igniting downward pressure in the market. This duality underscores the importance of market monitoring as traders navigate a landscape fraught with opportunity and risk.
In summation, Ethereum’s price behavior within the $3,500 to $4,000 range is indicative of a market grappling with dichotomous forces. While bulls remain hopeful for a bullish breakout, the persistent $4,000 resistance presents significant barriers to sustained upward momentum. Market participants must remain vigilant, as the dynamics of liquidity and sentiment could determine the trajectory of Ethereum’s price in the near term. With careful observation and strategic positioning, traders may capitalize on the unfolding opportunities that await.


Leave a Reply